
An overview of KPTrace:
| KPTrace is a Linux kernel infrastructure | Kernel patch which provides CONFIG_KPTRACE option Makes use of Kprobes Introduces breaks in system calls, IRQs, context switches |
| KPTrace is a set of tools (userspace) | Start/Stop tracing Produce "pretty print" traces Display statistics |
| GUI analysis tools | Proprietary: STWorkbench, for STMicroelectronics customers Open: FrameSoC, INRIA general trace tool |
| Available resources | KPTrace patches KPTrace tools Rebuild trace framework in YOCTO |
In a Linux context tracing can be used for a range of debugging and performance analysis tasks. The "systems" view provided by a tracing infrastructure such as KPTrace can also help to find non-functional issues in a multi-core environment, caused by what is known to be functional code interacting in a unexpected way. KPTrace is one of a number of tracing solutions available:
- Ftrace (kernel mainline > 2.6.28)
- Display traces through the debugfs filesystem /sys/kernel/debug/tracing/
- Ongoing work to collect traces through ARM Coresight*
- Perf (kernel mainline)
- Samples hardware registers to count instructions, cache-misses...
- Produces a sample report, not a trace
- LTTng (not in mainline - available since 1999)
- Provides a number of capture and analysis tools
- SystemTap (userspace tools)
- Parses a script to generate a "probe.ko" module
- Traces go to STDOUT on target
- KPTrace (not in mainline, stmicro kernel > 2.6.23)
- Targets embedded systems exclusively
- Traces are saved to file or captured through Coresight
- Completed with capture and analysis tools
*Linaro Connect Asia 14: LCA14-210 "ETM/ETB/Coresight"
KPTrace has been available since 2007 for SoCs based around SH4, ARMv5, ARMv6 and ARMv7 cores. One of the main intentions of the design is to minimise the level of intrusiveness during the tracing process. In KPTrace 3.x versions the trace data is saved to an ASCII file. In more recent KPTrace 4.x versions the trace data can be saved to a binary file or managed using the ARM Coresight technology. In the case where tracing is done without using a probe then the trace data is collected in a trace buffer. A low priority userspace thread transfers data from the buffer to the filesystem, and all measurements and statistics are processed after tracing. A traced function (entry/exit) experiences less than a 10 uS delay.
In this article we mainly cover Kptrace 3.x as the patches don't contain vendor specific components for the HW probe. KPTrace was tested on the following devices: ARMv6 (Raspberry Pi), dual-core ARMv7 (Wandboard).
KPTrace Components
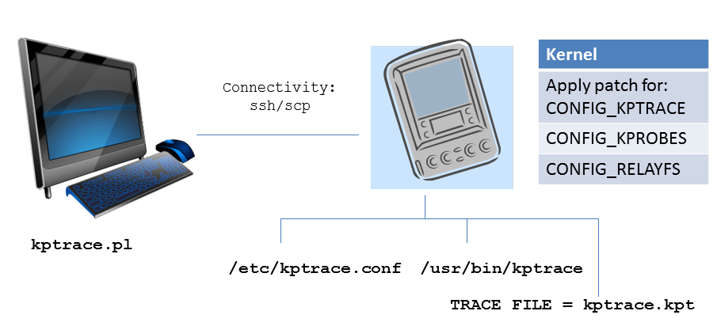

| Configuration | Trace Control | Trace Analysis |
| Select which kernel symbols to trace | Start and stop tracing | Display traces and statistics |
File:
/etc/kptrace.conf(on the target) |
File:
/usr/bin/kptrace(on the target) |
File:
kptrace.pl(on the host) |
The trace files are recovered from the target filesystem. Two different file types are generated: kptrace.kpt (ASCII raw trace data) and kptrace.kpm (symbols from /proc/kallsyms). These can then be processed by the kptrace.pl Perl script on the host to generate a human readable output on STDOUT, e.g.:
[host]$ kptrace.pl  kptrace.kpt kptrace.kpm
--- snip ---
6.698061 (0.000068) PID: 1545 (cat) IRQ: 16 (TMU0) [interval: 4041us]
6.698177 (0.000116) PID: 1545 (cat) Return from IRQ
6.698267 (0.000090) PID: 1545 (cat) irq_exit
6.698288 (0.000021) Context switch: 1545 (cat) to 4 (watchdog/0)
--- snip ---
Trace statistics are also generated by the Perl script, calculated from the data in the kptrace.kpt file:
[host]$ kptrace.pl  kptrace.kpt kptrace.kpm
------------------------------------------------------------------------
Interrupt      Fired  Freq (Hz)   Min (us)   Avg (us)   Max (us)     SD
------------------------------------------------------------------------
IRQ: 16(TMU0)  2702        249       3866       4000       4190       6
IRQ: 88(eth0)    97          8        297      24025     354473   63136
IRQ: 108(stm-asc)18          1        138        462       1171     286
The maximum values can then be retrieved from the trace itself, e.g. this is the context causing the 'delayed' timer interrupt (with an interval of 4190 us, shown above):
...
8.103074 (0.000503)(sh) syscall entry: sys_clone
8.103623 (0.000549)(sh) syscall exit: sys_clone
8.106204 (0.002581)(sh) IRQ: 16 (TMU0)
...
For a graphical display of trace data, there are a couple of options depending on which chipset is being used. STMicroelectronics provides a proprietary IDE, STWorkbench, which can be used to display traces from boards with ST chipsets (this is a condition in the EULA). For non-ST chipsets, a solution called FrameSoC has been developed as part of an INRIA (French Institute for Research in Computer Science and Automation) research project. This solution consists mainly of open components and support a variety of trace solutions including KPTrace, Paje and Tima. 
The kernel patches referred to above add these files:
arch/arm/include/asm/kptrace_target.h; arch/arm/kernel/kptrace.c; include/trace/kptrace.h; kernel/kptraceand modify these files:
arch/arm/Kconfig; arch/arm/kernel/Makefile; arch/arm/kernel/traps.c; kernel/Makefile; kernel/trace/KconfigThe modifications mainly occur in the build system.
The Kernel trace infrastructure for KPTrace 3.x requires the following kernel configurations:
- CONFIG_KPROBES - add breaks into kernel code
- CONFIG_RELAYFS - copy data from buffer to file
KPTrace also implements an API to instrument code, allowing tracing to stopped/started programmatically and extra information written into the trace data.
#include trace/kptrace.h
/* add data to the trace */
kpprintf(char *fmt); /* Replacement for printk! */
kptrace_mark(void); /*<= prints "MK" */
/* pause/resume tracing */
kptrace_pause(void)
kptrace_restart(void)
KPTrace also provides a couple of additional features, depending on the toolset in use. "Flight record" mode allows traces to be written to a circular buffer (the default buffer size is 1MB but this is configurable). Traces are committed to a file from the buffer only if tracing ends gracefully. If the STMicroelectronics toolset is being used then it is also possible to recover traces through the JTAG port. This can be very useful for recovering traces from a crashed system. It is also possible to trace user-space processes, using two instances of KPTrace; the first instance traces the kernel and the second instance traces a list of symbols from a process.
The tracepoints to be traced are defined by the kptrace.conf file which is resident on the target root filesystem. The conf file contains kernel symbols grouped in "sets" which will be traced:
| core_kernel_events | __switch_to handle_edge_irq tasklet_hi_action |
| ssyscalls | sys_read sys_write sys_fork do_execve sys_statfs |
| memory_events | __kmalloc kfree do_page_fault __get_free_pages |
| network_events | netif_receive_skb dev_queue_xmit sock_sendmsg |
| timer_events | do_.setitimer it_real_fn run_timer_softirq |
| synchronization_events | down up mutex_lock mutex_unlock |
| user | c_show |
Solving Real World Problems

An example of where KPTrace was used to solve a real world problem is this example from an STMicroelectronics STB application, where choppy audio and video was observed. KPTrace data was collected and looking at the timer interrupt statistics it was clear to see that although the average interval was close the expected value of 1000 uS, the maximum interval observed was 7321 uS.
Examining the trace flow at the time of the maximum interval showed clearly that the delay was caused by a co-processor reset and that the waiting thread needed to be modified so as to be interruptable. This is a good example of how the "systems view" provided by KPTrace makes solving this class of problem much easier than by using traditional methods.
KPTrace Patches and Deployment
The stages followed to deploy KPTrace on other platforms are:
1. Generate KPTrace 3.X patches: This was done by first cloning the STLinux Git repository and checking out the mainline release tag 3.4.9. By cherry-picking the appropriate commits it was possible to generate a set of patch files, using the git 'format-patch' feature:
0001-kptrace-Update-to-latest-version.patch> 0002-kptrace-Convert-from-a-sysdev-to-a-real-device.patch 0003-kptrace-Remove-unnecessary-strcmp-from-userspace_sto.patch 0004-kptrace-Remove-BKL-tracing.patch 0005-kptrace-Remove-tracepoint-on-sys_nfsservctl.patch 0006-kptrace-Fix-mutex-tracing-when-lock-debugging-is-ena.patch
2. Having previously set up a Ycoto environment for the Wandboard, the next step is to apply these patches using 'git am' in tmp/work/ (this preserves the history). The first patch "0001" causes issues which can be fixed with: 'git apply -reject'. Once all of the patches have been applied then KPTrace should be seen as an option in the kernel configuration menu:
host$ make ARCH=arm menuconfig

3. It also possible to create a Yocto layer for KPTrace, adding the KPTrace config to the kernel recipe.
Summary
- There are many competing Linux trace infrastructures
- A "systems" view is essential for SoCs
- KPTrace is a stable user-friendly product
- Easy to get started